Game performance: understand frame time before optimising
Learn how frame time relates to FPS, use an interactive frame-budget calculator and plan a repeatable profiling check before changing your game.
 , 4 min read

When a game feels slow, start by recording where and when it happens. Choose a device, a repeatable scene and the behaviour you want to investigate. Then measure before changing the implementation.
Frames per second is useful for describing the result, while frame time expresses the time between frames in milliseconds. Epic’s profiling introduction uses both measures and stresses consistent performance as well as the target frame rate. Epic’s performance profiling introduction
For an initial investigation, frame time gives you a clear unit to compare with a target. It does not identify the cause by itself.
What does a frame budget mean?
There are 1,000 milliseconds in a second. For evenly spaced frames, divide 1,000 by the target frames per second:
| Target | Time available per frame, rounded |
|---|---|
| 30 FPS | 33.33 ms |
| 60 FPS | 16.67 ms |
| 120 FPS | 8.33 ms |
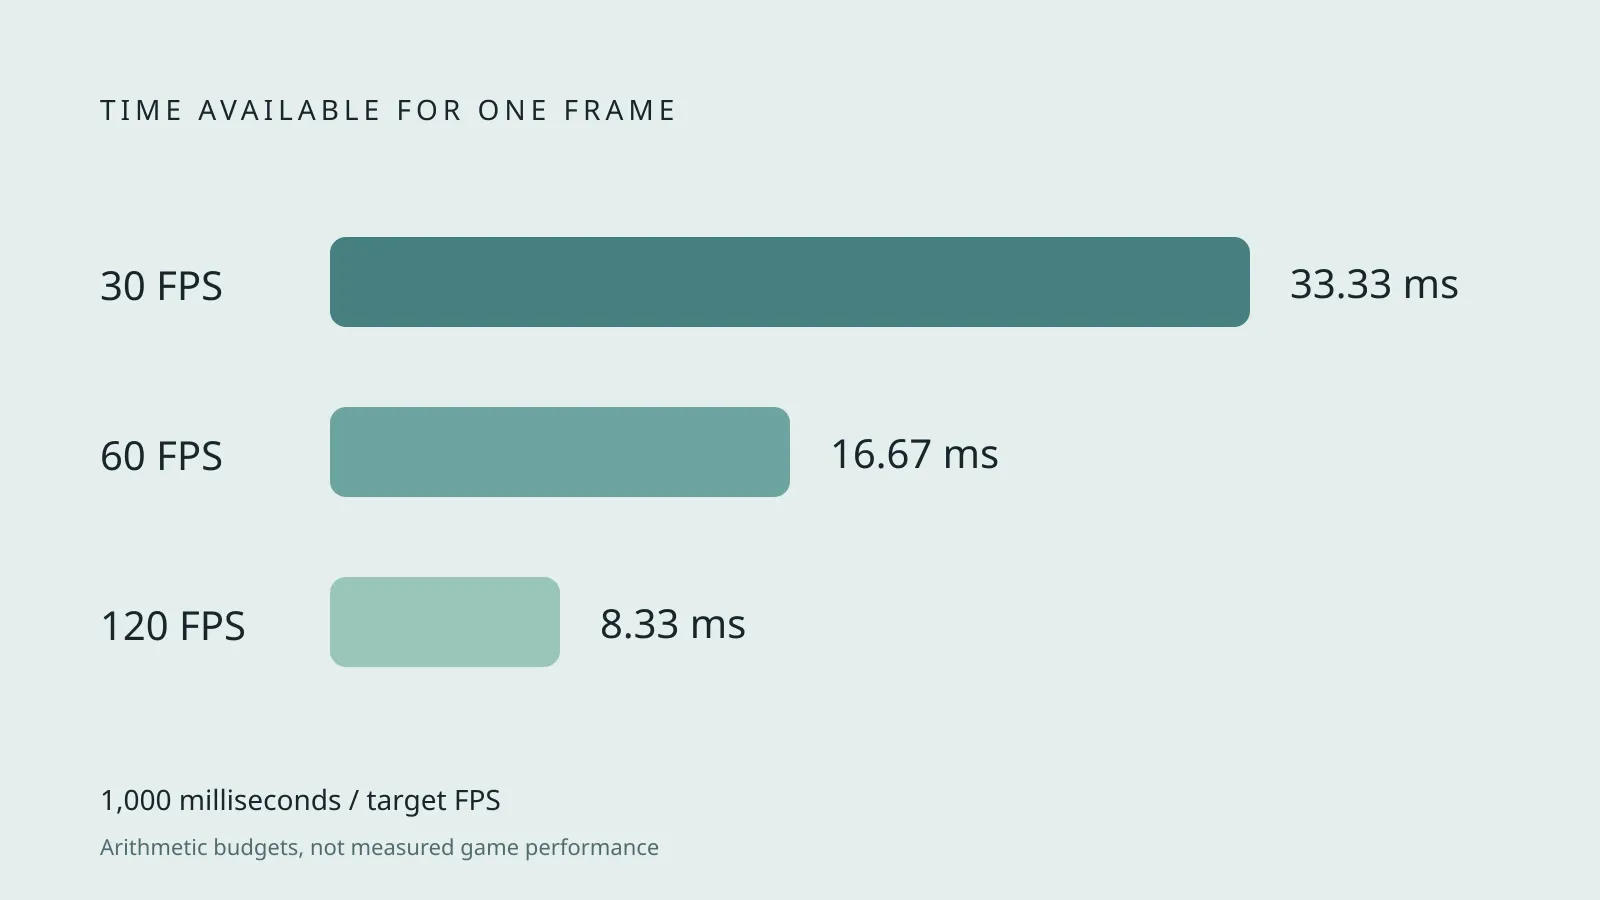
These are arithmetic budgets, not measured results from a game. A frame lasting 20 ms is longer than the 60 FPS budget, even if another scene in the same project runs comfortably below it. If you increase the target from 60 to 120 FPS, the time available for each frame is halved.
Try the calculator with a measured total frame time or a hypothetical value. It compares one value with a budget and does not run a performance test on your device.
Averages can hide the moment you noticed
Imagine two hypothetical ten-frame samples. In one, every frame takes 16 ms. In the other, nine frames take 12 ms and one takes 52 ms. Both samples average 16 ms, but their timing is different. The second sample contains a much longer frame that the average conceals.
Record a frame-time trace around the action that feels slow. Look at the slow frames, their frequency and what was happening when they occurred. If you report a percentile, state which one and the sampling conditions. Keep the sample long enough to include the behaviour you are investigating, such as entering a new room or opening a busy menu.
Also distinguish time spent waiting for a frame cap from time spent doing work. A steady display interval alone does not tell you how much spare processing capacity remains.
Make a repeatable baseline
Before experimenting, record the conditions that could change the result:
- Device model, operating system and relevant graphics settings.
- The game version and whether it is a development or release configuration.
- Resolution, frame cap and the scene or saved state used.
- The actions performed, including any warm-up period.
- Whether a profiler or other recording tool was attached.
On a phone, keep track of temperature, charging state and how long the game has been running too. For a first comparison, repeat the same route under similar conditions rather than comparing a fresh launch with a long session. If you cannot reproduce the slowdown consistently, improve the reproduction before judging a small change.
Find the expensive work
Use the engine’s profiler to investigate the relevant CPU, rendering and GPU activity. Do not add CPU and GPU timings together and call the sum the total frame time. Those workloads can overlap. Epic’s stat-command documentation explains its frame timing in relation to the game, draw and GPU work, with the overall frame often close to the largest of those timings. Epic’s stat commands
Use that as a reason to inspect the actual pipeline, rather than infer the bottleneck from a single FPS number. A scene with expensive simulation needs a different investigation from one dominated by rendering. Loading stalls and recurring allocation work may need attention at particular moments rather than throughout the entire scene.
Wube’s historical Friday Facts #209, published in 2017, provides a concrete example of investigating representation and processing costs. The team described replacing a 256-byte smoke entity representation with a 32-byte simpler representation stored contiguously. Those figures describe the data for that smoke representation, not an eightfold improvement in the whole game’s speed. Wube’s optimisation article
The practical lesson I take from that example is to identify what work and data the game actually needs before choosing an optimisation. It is not a reason to copy that representation into an unrelated project.
Change one thing and compare again
Write a hypothesis narrow enough to check. For example: “This repeated search appears in the slow frame, so caching its result may reduce that work.” Then rerun the same scenario, compare the relevant timings and check that the behaviour still works.
If the result varies as much as the proposed improvement, gather better evidence before claiming a win. If a change improves one scene while making loading, memory use or another device worse, include that cost in the decision. Keep the simpler implementation when the measured benefit does not justify the added complexity.
Your final note can be short: what was slow, how you measured it, what changed and what the comparison showed. That is useful evidence for the next performance problem too.