Google said 1,000 people played my games. It was 83.
Google Analytics said about 1,000 people played my games in four weeks. Most were Google's own test phones. How I found the real 83, and how to check yours.
 , 10 min read
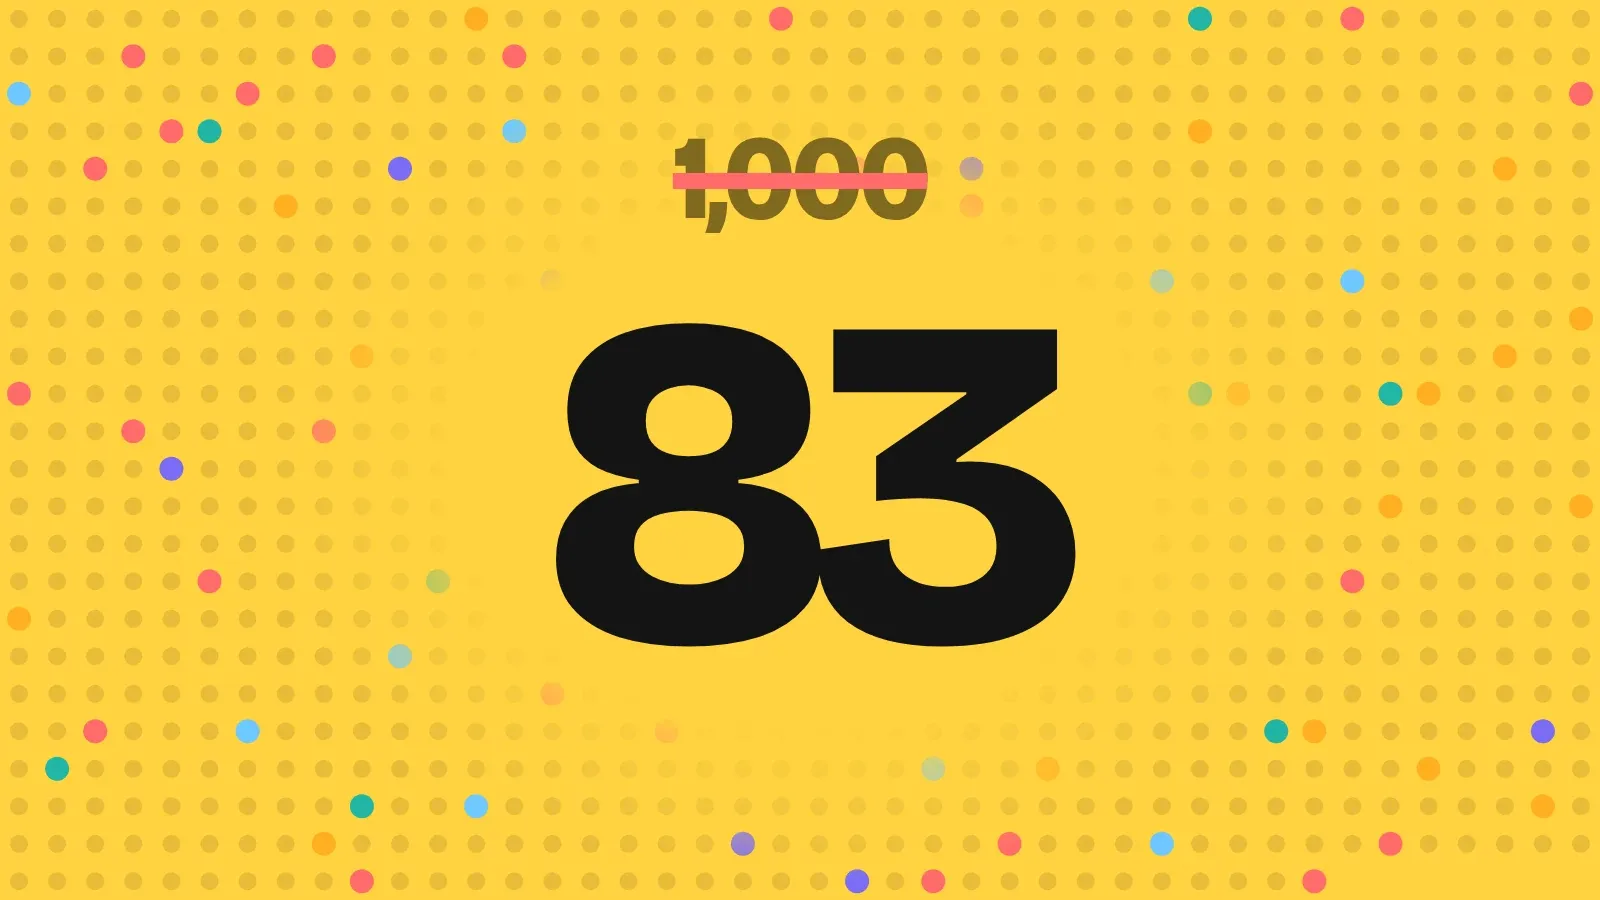
Google Analytics told me that about 1,000 people played my games in four weeks. The real number was 83. The other 918 were robots, computers pretending to be phones, and me.
This is how I found out, what the 83 real players actually do in my games, and how you can check your own numbers in five minutes.
The number on the screen
I make small puzzle games for Android. Nine of them so far, all on Google Play. Four are out for everyone, and five are still in testing.
Every game sends Google Analytics a few simple events: the game opened, a level started, a hint was used. Analytics adds them up and shows a home page with one big number at the top: users.
Week by week, that number looked like this:
| Week starting | Users, as Analytics counted them |
|---|---|
| 5 October | 41 |
| 12 October | 106 |
| 19 October | 117 |
| 26 October | 346 |
| 2 November | 130 |
| 9 November | 363, and the week is not over |
Look at the week of 26 October. That is the week Hako, Rinse, Seiche and Sunwise came out. The count nearly tripled.
If you only look at that table, every launch brings a wave of new players. And over the last four weeks, Analytics counted 1,001 users in all.
I took that number at face value for a while.
The day it fell apart
On 10 November I checked each game properly, one at a time. Not the home page. The actual rows underneath it.
I split the users by phone model. A real audience is a long list of different phones, a few of each.
At the top of mine was one phone with 741 users. A OnePlus 8 Pro. A phone from 2020.
741 out of 1,001. Nearly three in every four of my “players” owned the same six-year-old phone.
That is not how real people buy phones. So I started digging.
The clues
Clue one: no country. Analytics guesses a country for almost everyone. Of the 741 OnePlus 8 Pro users, 717 had no country at all. The other 24 showed up from Egypt, Bangladesh, Brazil, Russia and more, and 23 of them came to one game on just two days.
Clue two: the same software. Every single one of the 741 ran Android 11. Real owners of a 2020 phone would be spread across years of updates. These were identical.
Clue three: ten seconds. Those 741 users made 714 visits between them. The visits added up to 7,665 seconds. That is about 11 seconds a visit. Open the game, wait, close it.
Clue four: nobody came back. 741 users and 714 visits means almost all of them came exactly once. Real people who like a game come back.
Clue five: they come when I release. Then I lined the test phones up by day, next to the days I sent new versions of my games to Google Play.
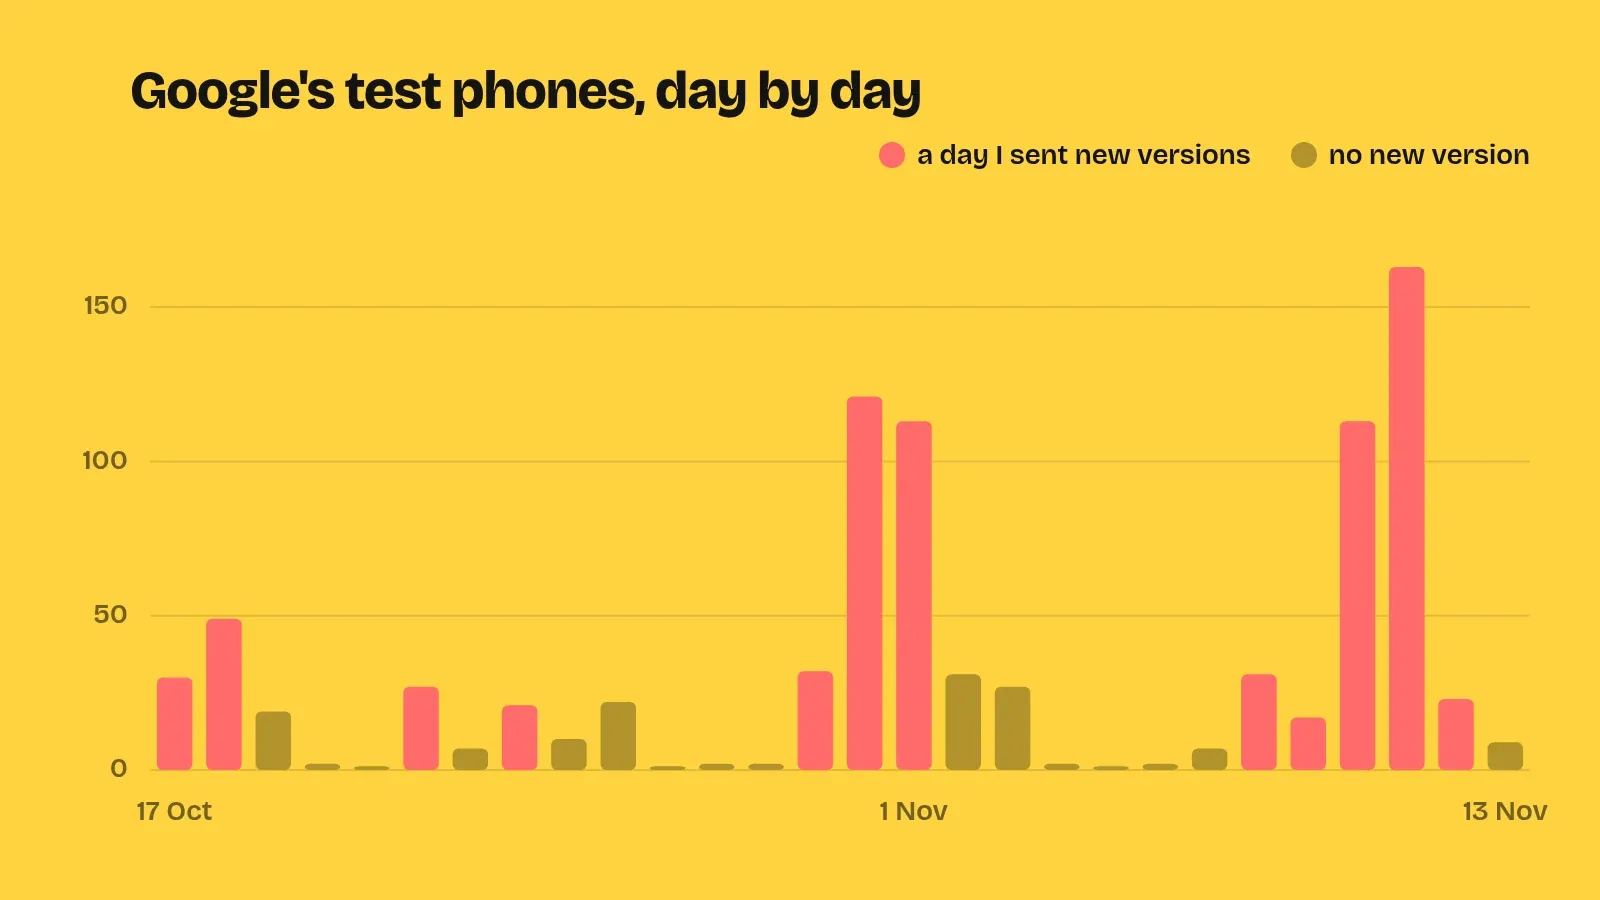
On 11 November I sent new versions of all nine games. 163 test phones turned up that day. In the quiet stretches, like 27 to 29 October and 4 to 6 November, there were two at most a day. Nearly all the rest came on release days, or a day or two after.
Clue six: phones that are not phones.
Second on the list were 143 users on a phone called sdk_gphone64_arm64.
That is not a phone you can buy.
It is an Android emulator, which means Android running on a computer.
Each one stayed about seven minutes, which is a long time for a robot.
Long enough to tap every button on every screen.
The robots have a name
Google checks every version of an app that goes to a Google Play test track. It installs the game on its own test phones and lets a robot explore it, looking for crashes, broken screens and security problems. This is called the pre-launch report, and it runs automatically.
It is genuinely useful. It tests my games on phones I will never own.
But the robot opens my game exactly the way a new player would. So Analytics counts every robot as a new user.
Analytics cannot tell me which visits came from Google, so I cannot prove every one of those 741 phones is theirs. But a 2020 phone with no country, one Android version and ten-second visits that arrive on release days does not leave much doubt.
The last suspect was me
Third on the list was a phone I know very well. Mine.
Every time I install a fresh version to try it, Analytics sees a brand new player. In four weeks, my one phone showed up as 34 different people. Those 34 “people” made 167 visits and played for almost 12 hours.
1,001 minus 918
So here is the whole sum.
1,001, minus 741 test phones, minus 143 emulators, minus 34 copies of me. That leaves 83.
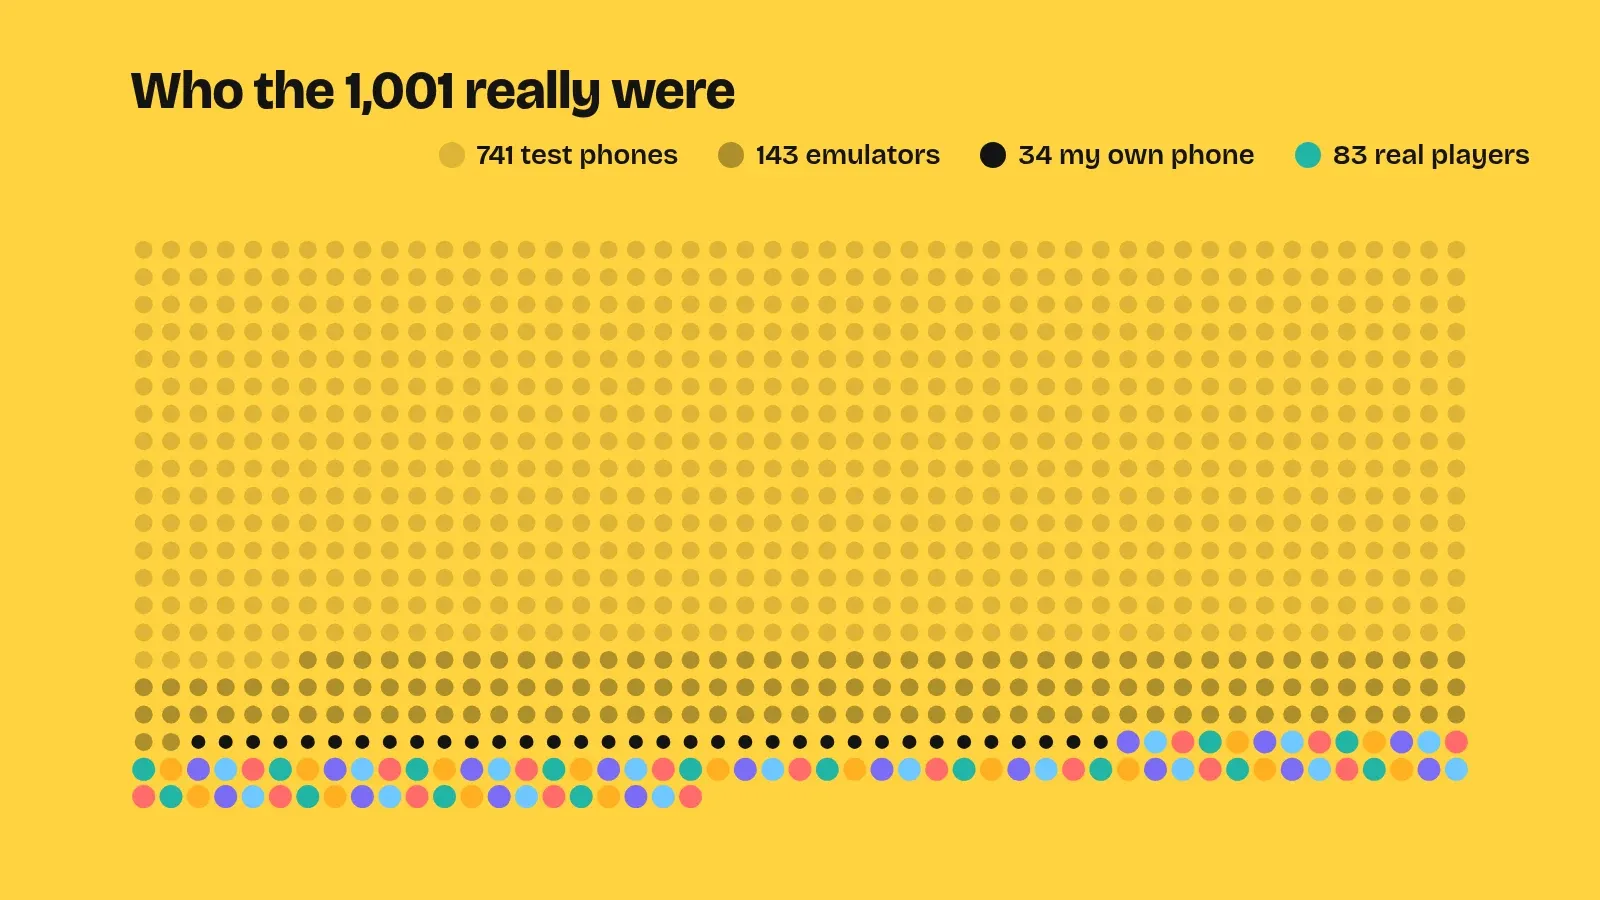

Even 83 is a little generous. A few of them opened a game once for zero seconds, from phones like a Pixel in the United States. Some of those are probably test phones too.
And Analytics counts a player once in every game they open. Someone who tries three of my games is three of the 83. Counted by phone, the 83 come from about 60 phones.
What the real 83 actually do
Here is every game, with the real players in colour.
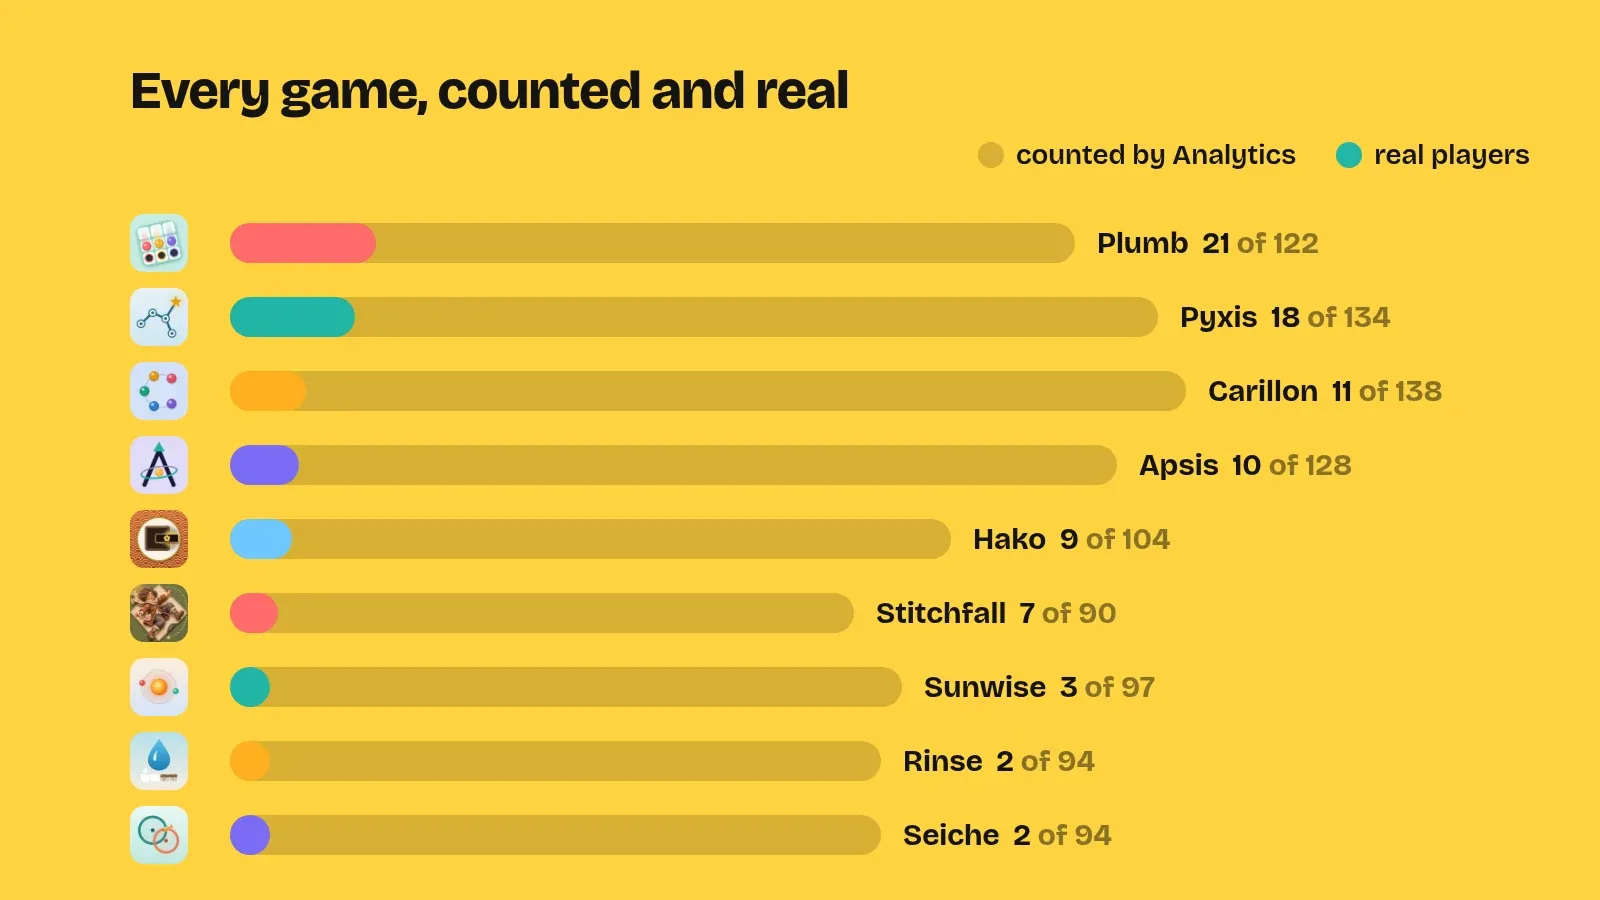
Carillon looked like my most played game. In real players, it is third.
And numbers of people are only half of it. How long they stay tells you much more.
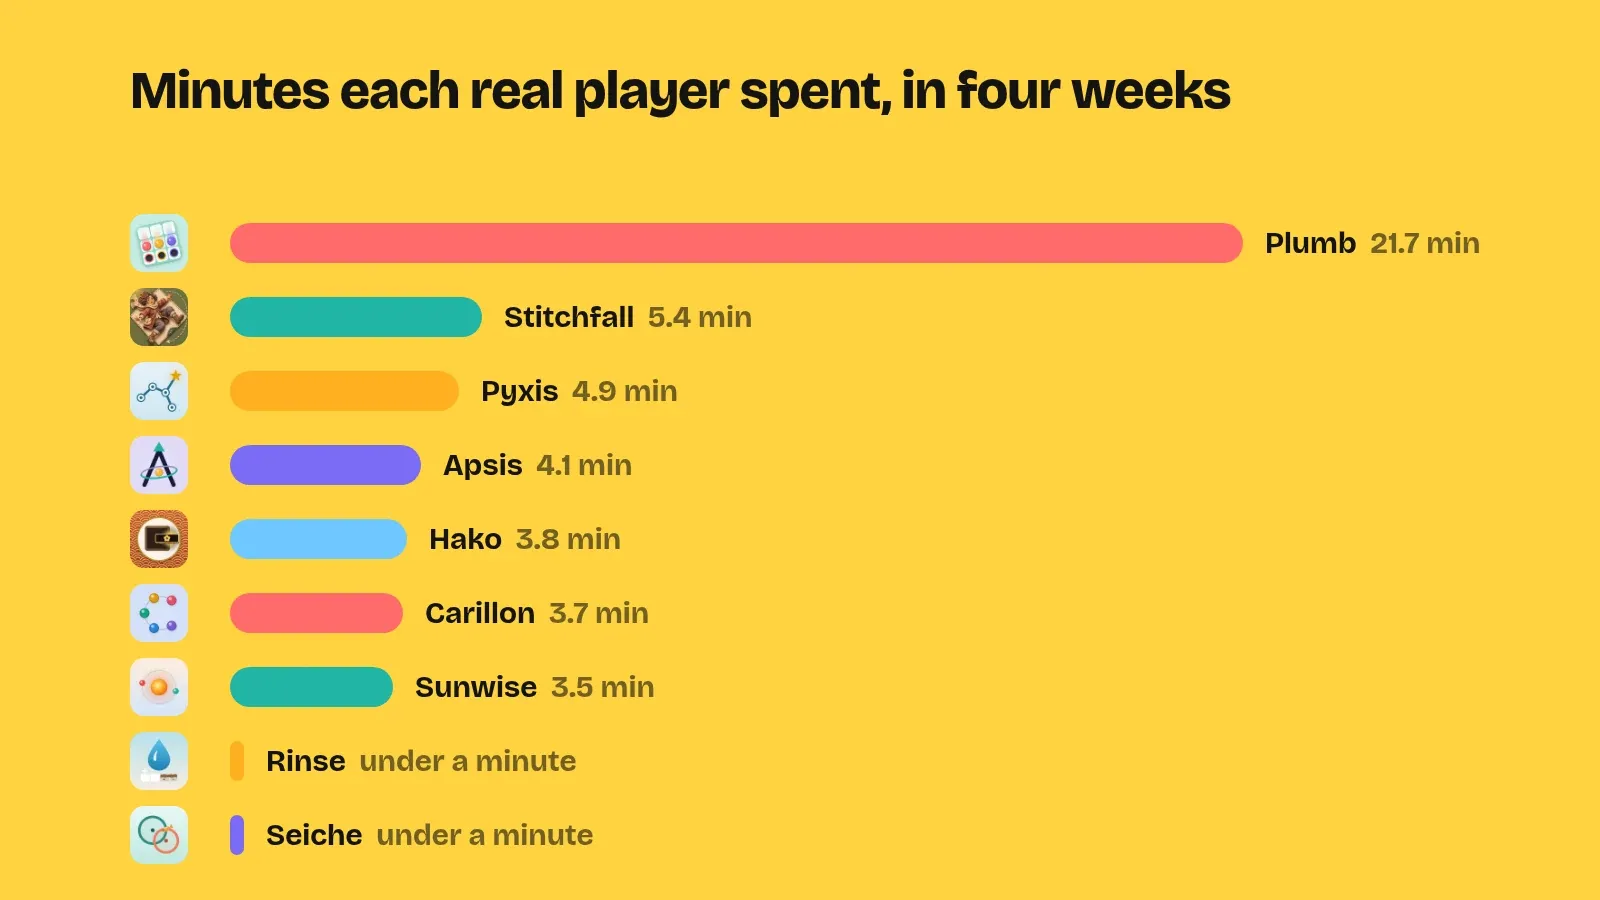
Plumb has 21 real players, and they stay for almost 22 minutes each. Four of them asked for hints. Two of them played the daily puzzle. Almost two thirds of all the time real people spent in my games was spent in Plumb.
Pyxis has 18 players at about five minutes each. Four of them leaned on hints, 37 between them. Three shared it with someone.
Stitchfall has seven players. Four of them cleared at least one room, and between them they came apart and sewed back together 201 times. That is the most fun number in this whole post.
Hako players came back about five times each, but for under a minute a visit.
Carillon and Apsis got a short look from most people, about four minutes each.
Sunwise, Rinse and Seiche are still in testing, and their few real players are mostly my testers. Two people opened Rinse and two opened Seiche, and nobody stayed a full minute. Meanwhile, Google’s test phones spent about two hours in each of them.
Two more hard numbers. Real players uninstalled my games 25 times in these four weeks. And for most of the 83, Analytics cannot say how they found the game. 14 found one on Google Play by themselves, and 5 came from links on this website.
Where the hours went
Time tells the same story as people.
In those four weeks, Google’s test phones spent about 19 hours in my games. All 83 real players together spent about 12. And I spent almost 12 on my own phone.
I played my own games about as long as everyone else put together.
The store’s own count
Google Play Console counts installs from the store itself. For the four games that are out for everyone, it counted 27 new installs from 17 October to 8 November, the latest day its reports cover. Analytics, over almost the same weeks, said 507 new players for those four games.
27 against 507. When the two disagree that much, believe the store.
Check your own numbers in five minutes
If you make Android games or apps and use Google Analytics, your numbers are probably doing the same thing. Your test phones may not be the same models as mine, so look for the clues, not the names.
Minute one: open the phone list. In Google Analytics, open Reports, then Tech, then Tech details. Switch the table to Device model, and set the dates to the last 28 days. Add Country as a second column with the plus button next to the column name.
Minute two: look for the clues.
One model sitting on top with hundreds of users.
A country of “(not set)”.
An average engagement time of a few seconds.
Names that start with sdk_gphone, which are emulators.
If you switch the table to OS with version, the suspects will all share one.
Minute three: find yourself. Your own phone is the model whose count goes up every day you test. It is usually near the top too.
Minutes four and five: build a clean view.
Go to Explore and start a blank exploration.
Add the dimensions Stream name and Device model, and the metrics Active users and Average engagement time per active user.
Put Stream name in the rows and the two metrics in the values.
Then add a filter: Device model, does not match regex, and the names you found, like OnePlus8Pro|sdk_gphone.*|YourPhone.
Give it a name.
That is your real player count, game by game, and it stays saved.
Here is mine, before and after the filter.
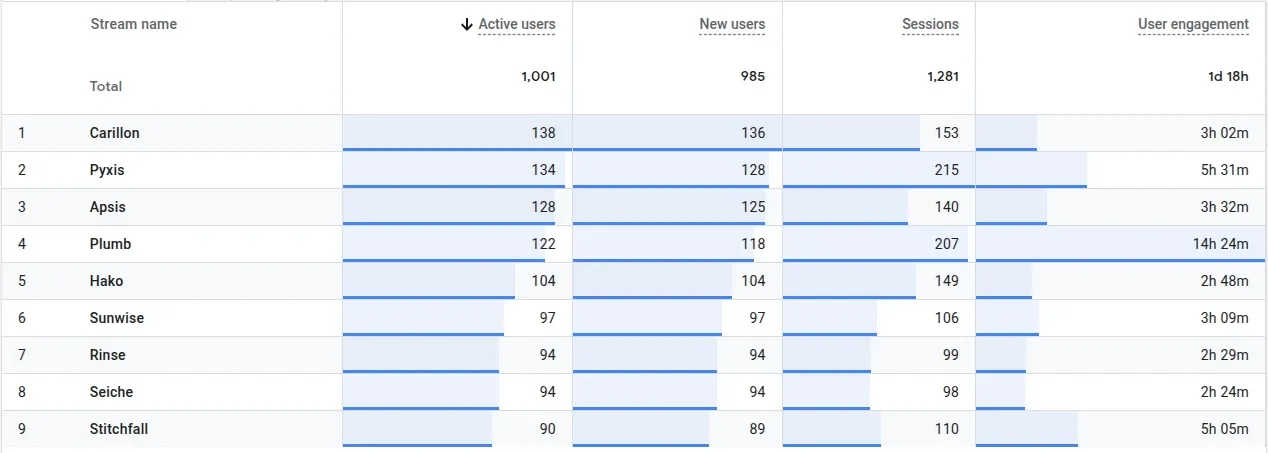
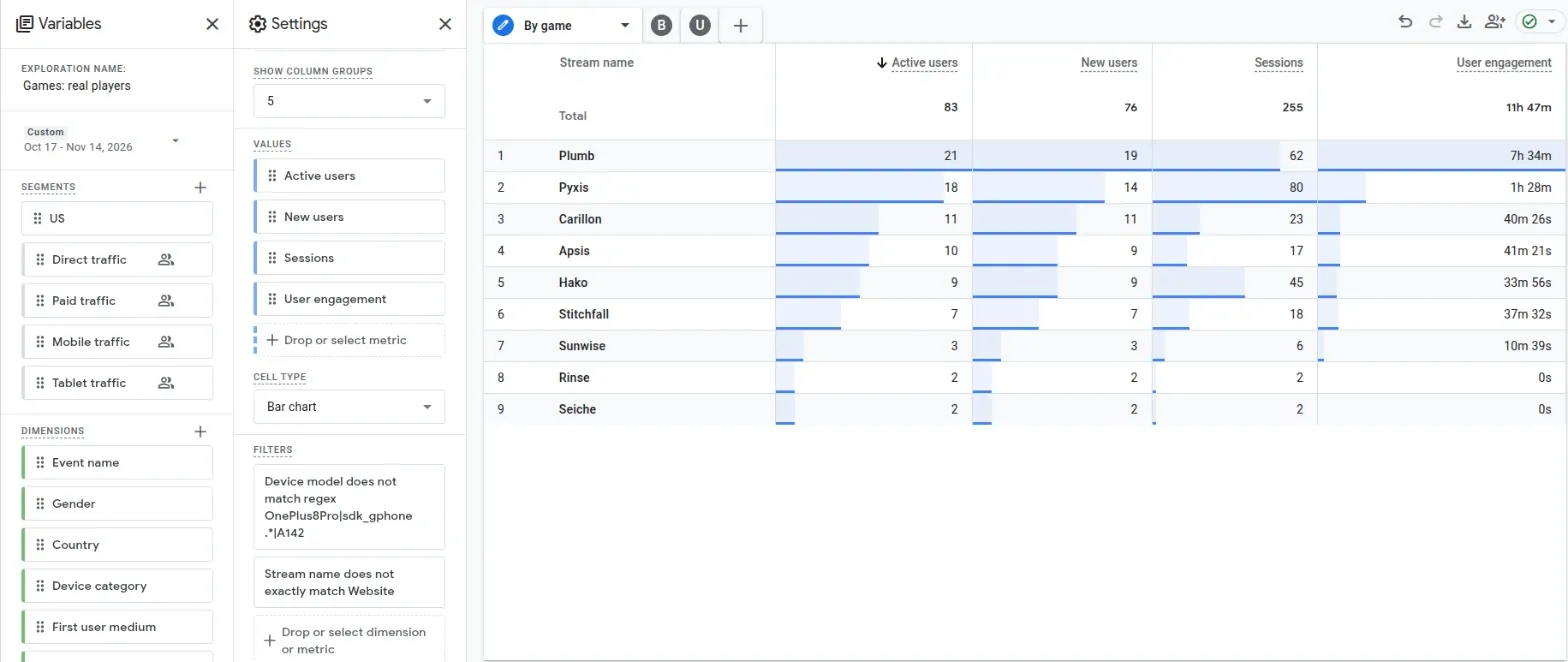
Then check it against the store. Open your app in Play Console and compare its new installs with your clean view. They will not match exactly, because not every player agrees to be counted. But they should be the same size. If one says 27 and the other says 507, you know which one to trust.
If you want the robots gone for good, there are two more options.
Firebase’s docs describe a setting called firebase.test.lab that reads “true” on its test devices, so a game can skip analytics there.
Some developers say it misses a few devices.
Or you can turn the pre-launch report off in Play Console, under the pre-launch report’s settings.
I keep mine on.
It finds crashes on phones I will never hold, and that is worth more than a clean graph.
What I do now
I do not read the Analytics home page anymore. I read the clean table, every week, and I write the numbers down.
83 is a small number. But it is a real one, and real numbers are the only ones you can make decisions with. They told me that Plumb is the game people stay in, so Plumb comes first now.
What 83 players mean for money is its own story, in How I earned $0 from 9 games.
And if you want to be player number 84, start with Plumb.